Semantic layers are supposed to be the trust boundary. The governed interface between messy warehouse tables and the metrics your organization depends on. Whether you are running a dbt Semantic Layer, a BI-platform semantic model, or a natural-language data agent that translates questions into SQL — the implicit promise is the same: if the query goes through the semantic layer, the answer is trustworthy.
That promise rests on assumptions that most implementations do not actually verify.
Governance language in semantic-layer documentation tends to focus on schema contracts, access controls, metric definitions, and freshness SLAs. These are necessary. They are also incomplete. None of them measure whether the underlying model still carries the same distributional signal it carried when the metric definition was authored and validated.
In a previous article, I described why Shannon entropy catches data quality failures that schema validation structurally cannot. In a follow-up, we validated that claim across nearly 6.6 million rows of real-world data in a preregistered benchmark program. This article applies that evidence to an adjacent architecture that is increasingly central to how enterprises consume data: the semantic layer.
Where Semantic Layers Fail Silently
A semantic layer defines metrics as functions of columns. Revenue is SUM(order_amount) where order_status = 'completed'. Active users is COUNT(DISTINCT user_id) where last_login >= CURRENT_DATE - 30. Churn rate is a ratio of cohort counts. These definitions are governed, version-controlled, and tested against expected schemas.
The failure mode that schema validation does not cover is distributional. Consider what happens when the underlying order_status column — which historically carried five distinct values in a roughly stable proportion — quietly shifts to 92% 'completed' because an upstream system changed its default assignment logic. The schema is unchanged. The column is not null. Freshness is on time. The metric definition still compiles and executes. But the filter condition that made the metric meaningful now selects nearly the entire table instead of the intended subset. Revenue is overstated. Every downstream consumer — dashboards, reports, governed agents querying the metric — inherits the error.
This is not a hypothetical edge case. It is a predictable consequence of a monitoring architecture that validates structure without validating signal.
The same failure class applies to natural-language data agents and NL-to-SQL systems. These tools generate queries against governed models, and the governance contract implicitly assures the user that the results are sound. But if the agent constructs a valid query against a model whose underlying distributions have degraded, the answer will be structurally correct and informationally wrong. The agent has no mechanism to detect that the column it is filtering on has lost the distributional variation that made the filter meaningful. Worse, the user receiving a natural-language answer has even less visibility into the underlying data state than an analyst reviewing a dashboard would.
The Distributional Blind Spot
The order_status scenario above illustrates a five-category column collapsing toward a single dominant value. The same principle applies at any cardinality.
Schema validation answers: does the data conform to the expected structure? Freshness validation answers: did the data arrive on time? Neither answers the question that matters most for semantic-layer trust: does the data still carry the same information content it carried when the metric was defined and validated?
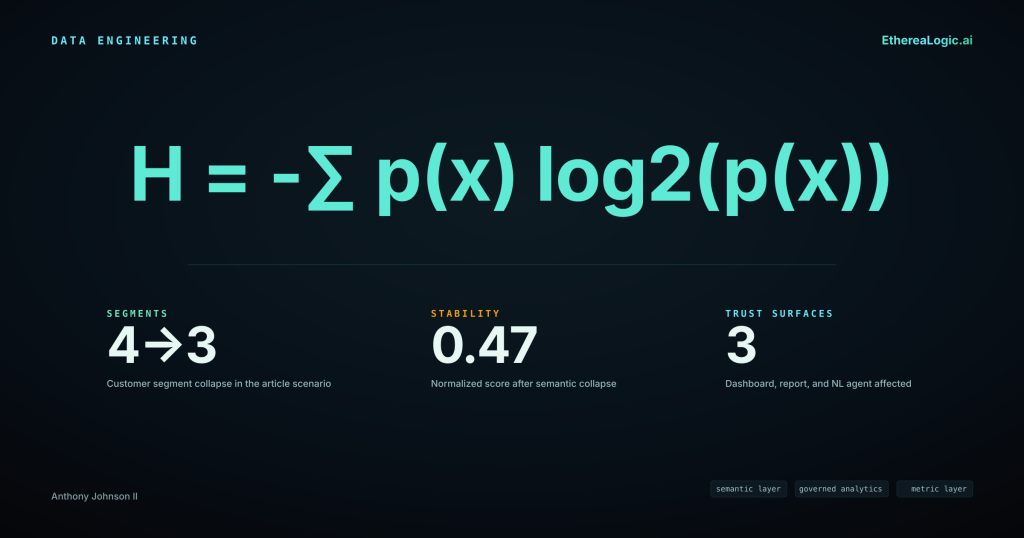
This is the question Shannon entropy is designed to answer. Entropy quantifies the information content of a distribution — how much uncertainty (or signal) a column carries. To make the mechanics concrete with a simpler example: a column with four evenly distributed categories carries 2.0 bits of entropy. If that column shifts to 92% concentration in a single value, entropy drops to approximately 0.5 bits. The schema is identical. The information content has collapsed by 75%.
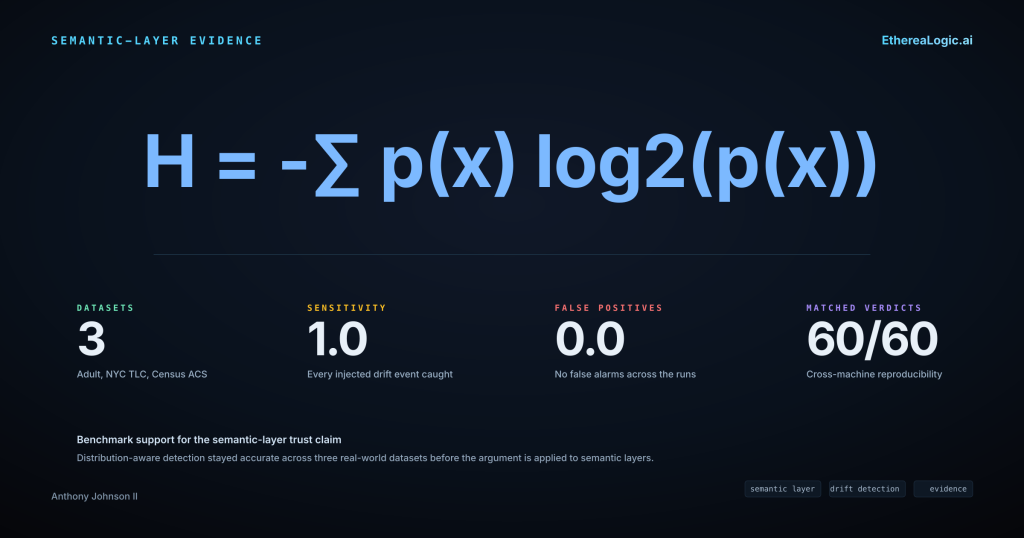
The benchmark program documented in the prior article tested this class of detection systematically. Across three independent real-world datasets — OpenML Adult Income (32,561 rows), NYC TLC Yellow Taxi (3,066,766 rows), and U.S. Census ACS PUMS (3,500,000 rows) — entropy-based drift detection achieved a sensitivity of 1.0 with a false positive rate of 0.0. The row counts are the specific benchmark samples used in each experiment; the full upstream datasets may be larger. Every injected distributional shift was caught. No false alarms were raised. Detection latency matched the evaluation window at 1.0 batch.
On quality validation, the distribution-aware approach achieved precision and recall of 1.0 on all three datasets, while a rule-based baseline modeled after standard constraint-checking patterns dropped to precision 0.6 and F1 0.75 on the Census ACS dataset — the dataset with the most complex distributional characteristics. The gap was not marginal. It was the difference between catching a class of failure and missing it entirely.
These results were produced on DriftSentinel 0.4.2+ and AetheriaForge 0.1.4+, and were reproducible across independent machines: 60 out of 60 gate verdicts matched with bitwise-identical non-latency metrics and matching configuration hashes.
A Concrete Scenario: Metric Drift in a Governed Semantic Layer
Consider a governed dbt Semantic Layer that exposes a monthly_recurring_revenue metric defined as SUM(contract_value) filtered on subscription_status = 'active' and grouped by customer_segment. The metric is used by a BI dashboard, an executive reporting pipeline, and a natural-language agent that lets product managers ask questions like “What is MRR for Enterprise customers this quarter?”
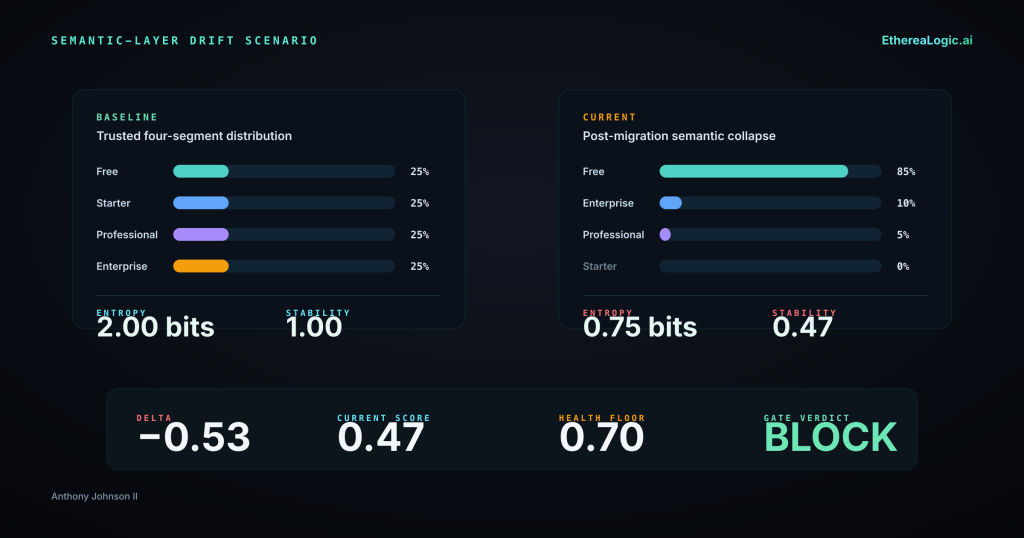
The underlying customer_segment column historically carried four values — Free, Starter, Professional, Enterprise — in a distribution that gave the grouping analytical meaning. Each segment represented a materially different population.
Now suppose an upstream CRM migration begins remapping its tier logic. The Starter tier is fully absorbed into Free. The Professional tier is being split: most accounts are reclassified as Free, a smaller portion moves to Enterprise, but the migration is still rolling — roughly 5% of accounts remain classified as Professional pending manual review. The column still has valid values. The schema contract passes. Freshness is on time. The dbt model builds successfully and all tests pass.
But the distribution has collapsed. What was a four-value column with approximately 2.0 bits of entropy is now a three-value column dominated by Free at roughly 85% of volume, with Enterprise near 10% and a residual Professional tail near 5%. Entropy has dropped to approximately 0.75 bits. The customer_segment grouping no longer differentiates populations meaningfully. The MRR metric, grouped by segment, now reports a massively inflated Free tier and a deflated Enterprise tier — not because customer behavior changed, but because the upstream classification shifted mid-migration.
Every consumer of this metric inherits the distortion. The BI dashboard shows a trend break that looks like a business event. The executive report flags a revenue concentration concern. The natural-language agent, when asked “How is Enterprise MRR trending?”, returns a number that is technically correct against the current data but misleading against the metric’s intended semantics.
A distributional check would have caught this before the metric was served. The normalized stability score — entropy divided by the theoretical maximum for the observed cardinality — would have dropped from approximately 1.0 to approximately 0.47. The detection is driven by the skewed concentration in the surviving values: the 85/10/5 split produces far less entropy relative to its theoretical maximum than a uniform distribution would. DriftSentinel classifies a column as collapsed when the delta between its current normalized score and the baselined score exceeds a configurable threshold (default 0.3). Here the delta is −0.53 — well past that boundary. Under a drift policy with a health score threshold of 0.70, this load would have been gated before it reached the semantic layer. The metric would not have been served until the distributional anomaly was investigated and resolved.
Practical Implications for Enterprise Teams
If your organization relies on a governed semantic layer — whether dbt Semantic Layer, a BI-platform metric store, or a natural-language data agent backed by governed models — there are specific gaps in the current trust architecture that distributional validation closes.
Metric definitions are only as trustworthy as the distributions they depend on. A metric defined as a filtered aggregation is implicitly a function of the filter column’s distribution. If that distribution shifts, the metric’s semantics shift with it — even though the definition has not changed. Validating the definition is necessary. Validating the distribution is what makes the output defensible.
Natural-language data agents amplify distributional failures. When an analyst queries a dashboard, they have some visual context for whether the numbers look reasonable. When a natural-language agent returns a single number in response to a question, there is no surrounding context to signal that the underlying data has degraded. The trust surface is smaller, and the consequence of a silent distributional failure is higher.
Run-over-run distributional stability is auditable evidence of metric fidelity. Schema tests and freshness checks produce binary pass/fail signals. A normalized entropy stability score produces a continuous, comparable measure of how much information content a column retains relative to its baseline. This score is auditable — it can be logged, trended, alerted on, and included in data contracts as a governed threshold. It answers the question downstream consumers actually care about: not “did the data arrive?” but “can I still trust the metric?”
Layer-aware coherence thresholds align with the Medallion architecture. AetheriaForge’s coherence scoring evaluates information preservation across transformations with configurable layer-specific thresholds — Bronze ≥ 0.5, Silver ≥ 0.75, Gold ≥ 0.95. These are AetheriaForge operating defaults, not Databricks-prescribed standards; the thresholds are configurable per data contract. For semantic-layer models that sit at the Gold level, a coherence threshold of 0.95 means the transformation from Silver to Gold must preserve at least 95% of the source’s information content. If a model refresh quietly drops distributional fidelity below that threshold, the coherence gate blocks the refresh before it reaches consumers.
Distributional validation is complementary, not competitive. This is not a replacement for schema tests, freshness monitoring, or access governance. It is the missing layer. Schema validation confirms structure. Freshness confirms timeliness. Distributional validation confirms that the data still carries the signal the metric was designed to measure. The combination is what makes a semantic layer’s trust promise auditable rather than aspirational.
Getting Started
Both tools used in the benchmark program are open source and available on PyPI. The benchmark results reported in this article were produced on DriftSentinel 0.4.2+ and AetheriaForge 0.1.4+. The pip install commands below install the latest available release; pin to the benchmarked versions if reproducibility against these specific results is required.
DriftSentinel monitors distribution stability over time using Shannon entropy as its primary signal. Configure monitored columns with a declarative drift policy, set health score thresholds, and gate loads that have lost too much distributional information before they reach downstream consumers.
pip install etherealogic-driftsentinelGitHub: github.com/Org-EthereaLogic/DriftSentinel
AetheriaForge scores information preservation across transformations. Feed it a source and target DataFrame, and it returns a coherence score — the ratio of entropy preserved through the transformation, capped at the source level so that noisy joins cannot mask information loss elsewhere.
pip install etherealogic-aetheriaforgeGitHub: github.com/Org-EthereaLogic/AetheriaForge
Both tools publish customer impact advisories (DriftSentinel, AetheriaForge) when defects are found that could affect operator decisions. If you are evaluating data quality tooling for governed analytics, look for that kind of transparency. It tells you more about engineering rigor than any feature comparison.
If your semantic layer’s trust story stops at schema validation and freshness, you have a measurable blind spot. Distributional validation closes it — and the evidence is now available to back that up.
Anthony Johnson II is a Databricks Solutions Architect and the creator of the Enterprise Data Trust portfolio. He writes about data quality, distribution drift, and the engineering patterns that make data trustworthy at scale.