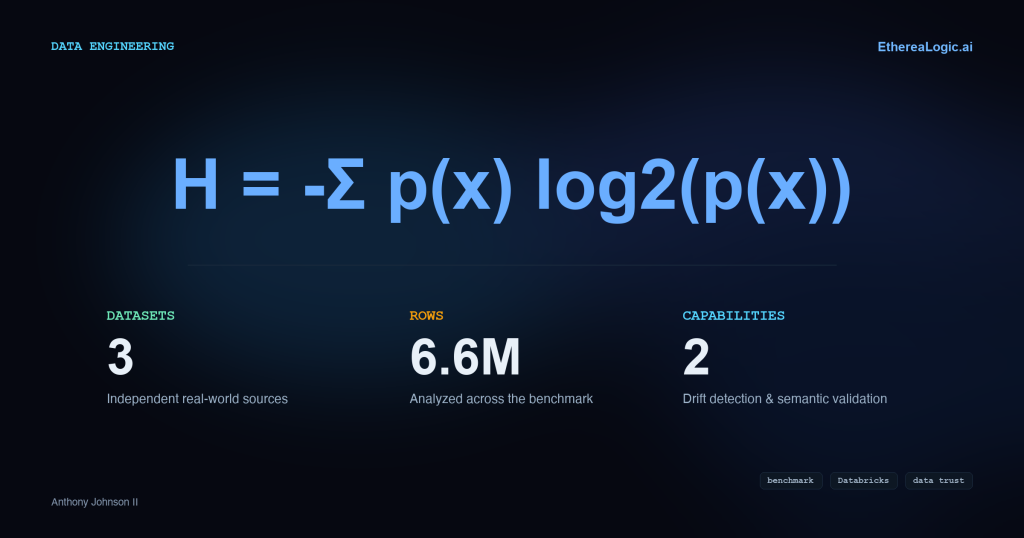
In a previous article, I laid out the case for why Shannon entropy — Claude Shannon’s 1948 measure of information content — catches data quality failures that schema validation, row counts, and null checks structurally cannot. The theory is clean: entropy measures whether a distribution still carries the signal your downstream logic depends on, not just whether the data arrived in the expected shape.
Theory is a starting point. Evidence is what earns trust.
Over the past several weeks, we ran a structured sequence of experiments to answer a harder question: does entropy-based monitoring actually outperform traditional tools on real data, at real scale, under conditions that matter to production Databricks environments?
The answer, across three independent real-world datasets and nearly 6.6 million rows, is yes — and the margin is not small.
The Research Program
We designed and executed three preregistered experiments with a single governing constraint: every claim must be backed by reproducible, append-only evidence. No retroactive adjustments. No cherry-picked datasets. Every run produces a provenance manifest with configuration hashes, dataset fingerprints, and gate verdicts that can be independently verified.
The experiments tested two capabilities against traditional baselines:
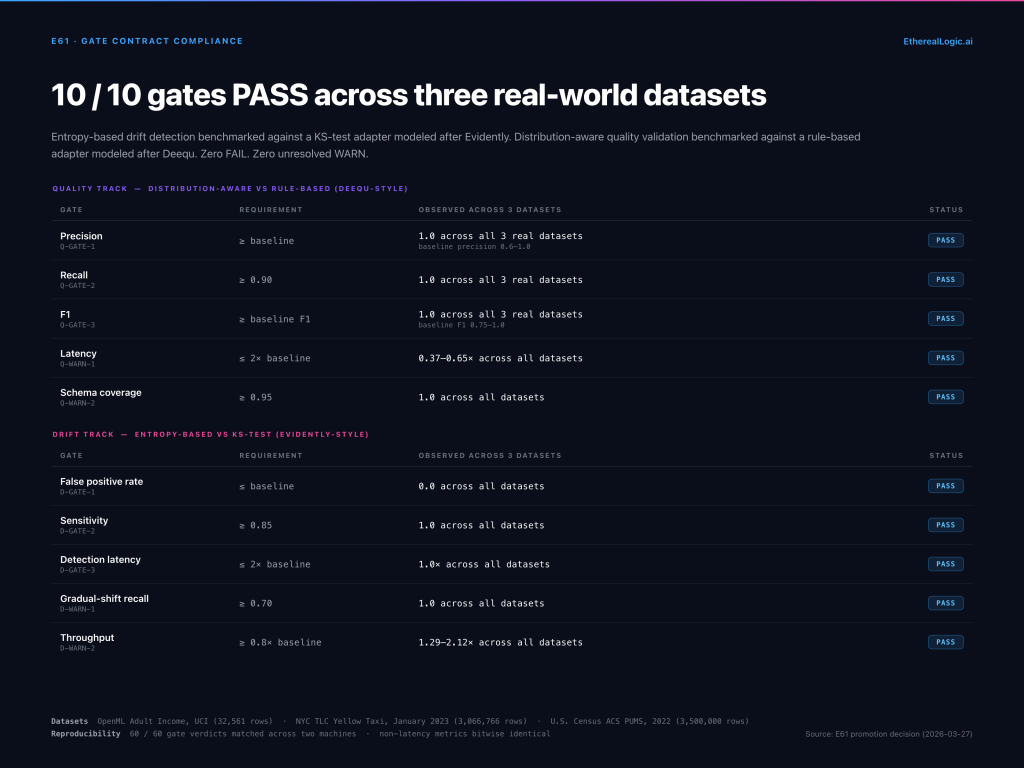
Distribution drift detection — using Shannon entropy stability scores to detect when a column’s information content has shifted, compared against a KS-test adapter modeled after the statistical drift detection approach used in Evidently, one of the most widely adopted drift monitoring frameworks.
Data quality validation — using distribution-aware semantic validation to detect source contract violations, compared against a rule-based constraint adapter modeled after the validation patterns in Deequ, the standard quality library for Spark environments. Where the rule-based adapter validates individual values against predefined constraints, the challenger evaluates the full distributional profile of each column — an approach informed by the same information-theoretic principles that underpin entropy-based drift detection.
In both cases, the baselines are simplified adapters designed to isolate the comparison against a specific detection mechanism — not full replicas of the Evidently or Deequ product surfaces.
The benchmark harness injected known faults into real data — schema violations, range violations, volume anomalies, gradual distribution shifts, and abrupt distributional breaks — then measured whether each approach caught them, how quickly, and with what precision.
Three Datasets, Three Domains, One Conclusion
The most important design decision was dataset independence. A result that holds on one dataset is a data point. A result that holds across three datasets with different schemas, domains, and scales starts to look like a pattern.
We selected three real-world public datasets that span materially different territory. The row counts below are the specific benchmark samples used in the experiment; the full upstream datasets may be larger.
OpenML Adult Income (UCI) — 32,561 rows of socioeconomic tabular data with categorical features like education level, occupation, and marital status. A classic benchmark with known distributional properties and well-understood feature interactions.
NYC TLC Yellow Taxi (January 2023) — 3,066,766 rows of transactional trip data with timestamps, geospatial coordinates, fare amounts, and payment types. High-volume, high-cardinality, and representative of the kind of operational data that flows through production lakehouses daily.
U.S. Census ACS PUMS (2022) — 3,500,000 rows of public demographic and earnings microdata from the American Community Survey. Wide schema, complex categorical encoding, and distributional characteristics that differ substantially from both the income and taxi datasets.
Combined: nearly 6.6 million rows across three independent data domains.
What the Benchmarks Showed
Drift Detection: Perfect Sensitivity, Zero False Positives
The entropy-based drift detector achieved a sensitivity of 1.0 (caught every injected drift event) with a false positive rate of 0.0 (never raised a false alarm) — across all three datasets. Detection latency matched the baseline at 1.0 batch, meaning it caught drift in the same evaluation window, with no delayed detection.
The KS-test baseline also achieved high marks on detection sensitivity. But the entropy approach matched it on every detection metric while providing something a KS-based approach does not naturally offer: a normalized measure of proportional information capacity that is intuitively comparable across columns with different cardinalities, including unordered categorical data where KS is not natively applicable. A stability score of 0.87 on a column with 4 categories carries the same operational meaning as 0.87 on a column with 100 categories — entropy is at 87% of the theoretical maximum for the observed support. That interpretability matters when you are building gate logic that needs to make automated pass/fail decisions.
The throughput advantage was also notable: the entropy-based approach processed data at 1.29x to 2.12x the baseline’s throughput across the three datasets. This matters less for batch workloads but becomes meaningful for high-frequency drift monitoring on large tables.
Quality Validation: Where the Gap Becomes Measurable
On quality validation, the distribution-aware approach achieved precision and recall of 1.0 on all three datasets. The rule-based baseline matched on two of the three — but on the Census ACS dataset, the baseline’s precision dropped to 0.6 and its F1 to 0.75, while the challenger maintained perfect scores.
Why did Census ACS expose the gap? The Census dataset has distributional characteristics that make rule-based boundary checks less reliable: overlapping value ranges across demographic categories, high-cardinality categorical fields with skewed distributions, and subtle schema interactions that look normal in isolation but carry measurable information loss when evaluated as a distribution.
This is exactly the class of failure that distributional analysis was designed to catch. A rule-based engine asks “is this value within the allowed range?” A distributional approach asks “does the distribution of values still carry the same information it carried in the trusted baseline?” When the answer to the first question is yes but the answer to the second is no, you have the kind of silent data quality failure that erodes downstream model performance without triggering a single alert.
The latency comparison reinforced this: the distribution-aware approach ran at 37–65% of the baseline’s wall-clock time across datasets. Faster and more accurate is a combination that rarely requires a complex trade-off discussion.
Cross-Machine Reproducibility
Every benchmark was re-run on a second machine — a Mac mini with a fresh dataset download, independent Python environment, and no shared state. The result: 60 out of 60 gate verdicts matched across both machines. Non-latency metrics were bitwise identical. Configuration hashes matched. This is the level of reproducibility that lets you trust the evidence is not an artifact of a specific environment.
From Benchmark to Live Execution
Benchmarks demonstrate capability. Live execution demonstrates operational viability.
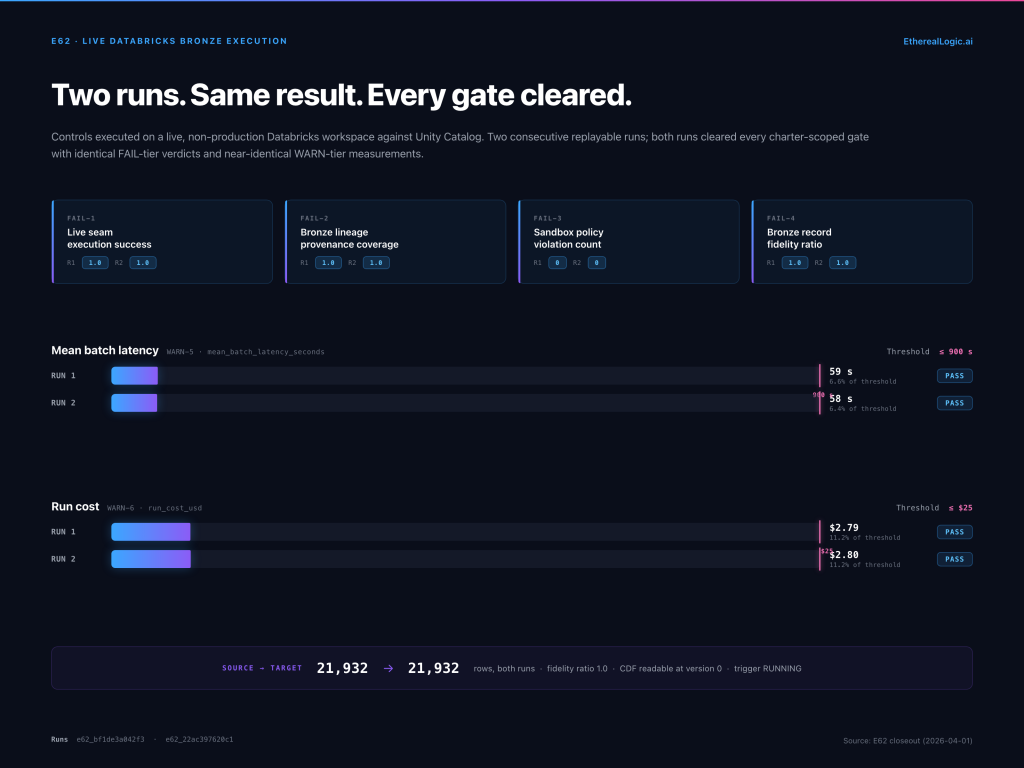
In a follow-on experiment, we took the validated controls and executed them against a live, non-production Databricks workspace. The goal was narrow and specific: show that the same drift detection and quality validation logic that passed benchmark gates could run as a real Databricks job, read from Unity Catalog tables, write evidence artifacts to a governed runtime volume, and produce measured cost and audit metadata.
Two consecutive replayable runs passed all charter-scoped gates, with a fidelity ratio of 1.0 (every source record accounted for in the output), inline cost measurement, and zero audit violations. This does not constitute production-scale proof — the experiment was explicitly scoped to Bronze-layer validation in a sandbox workspace — but it closes the gap between “this works in a benchmark harness” and “this works on Databricks.”
Natural Fault Validation
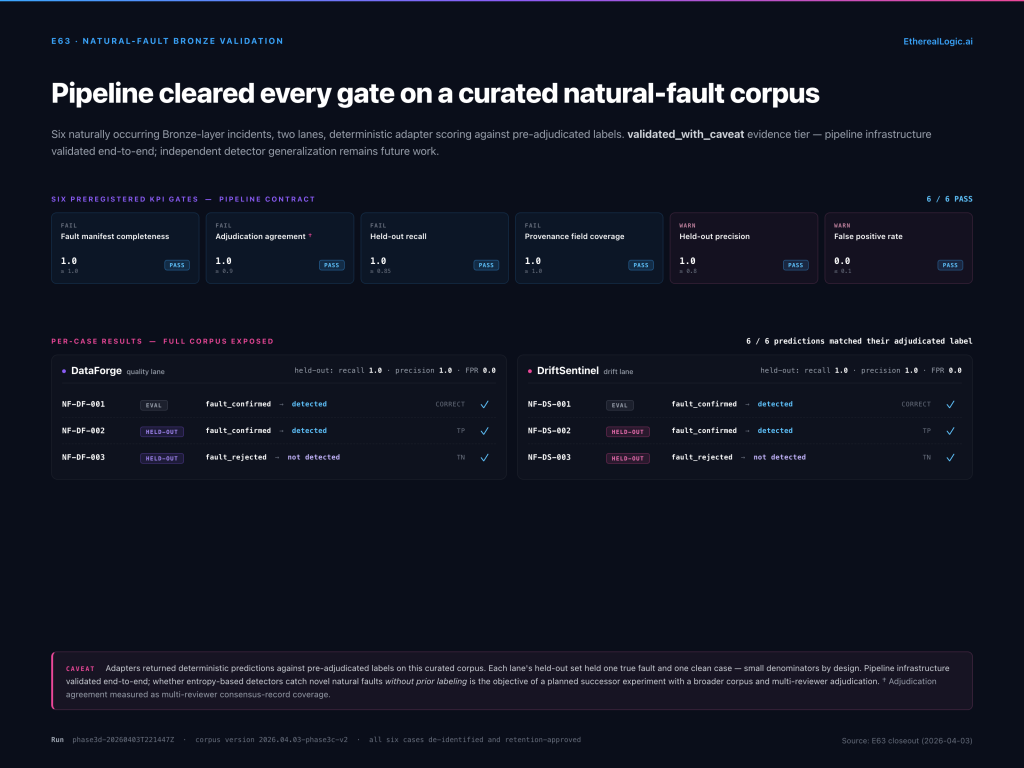
The third experiment carried a validated_with_caveat evidence tier from the outset, reflecting a deliberately narrow scope. The question it asked was not whether entropy-based detectors catch novel faults independently, but whether the governed pipeline infrastructure — manifest loading, lane routing, gate evaluation, evidence bundling — could execute end-to-end against a corpus of naturally occurring faults rather than synthetic injections.
We curated a corpus of six naturally occurring Bronze-layer data quality incidents — cases where ingestion pipelines produced data that was structurally valid but informationally degraded. Each incident was labeled, privacy-reviewed, assigned to either the quality or drift validation lane, and split into evaluation and held-out sets.
The full pipeline passed all six preregistered KPI gates on the curated corpus. Each lane’s held-out set contained one true fault and one clean case; both lanes detected the fault and correctly identified the clean case, yielding held-out recall of 1.0 and false positive rate of 0.0 on each lane independently. The detection adapters in this experiment used deterministic scoring against pre-adjudicated labels — validating the governed infrastructure, not independent model generalization. Proving that entropy-based detectors catch novel natural faults without prior labeling remains the objective of a planned successor experiment with a broader corpus and multi-reviewer adjudication.
What We Learned About Entropy in Practice
Three experiments, hundreds of benchmark run artifacts, and millions of rows later, a few practical lessons emerged that go beyond the numbers:
Normalization is non-negotiable. Raw Shannon entropy values are not comparable across columns with different cardinalities. The stability score — entropy divided by the maximum possible entropy for the observed number of distinct values — is what makes entropy operationally useful. A raw entropy of 1.5 bits means nothing without context. A normalized score of 0.75 means entropy is at 75% of the theoretical maximum for the column’s current distinct-value count. Note that the denominator is based on observed cardinality in each batch; DriftSentinel catches category disappearance by comparing the normalized score against the baselined snapshot, so a column that silently drops from 12 categories to 8 will trigger a drift classification even if the surviving 8 remain uniformly distributed.
Layer-aware thresholds match how lakehouses actually work. AetheriaForge ships with default coherence thresholds aligned to Medallion architecture layers: Bronze ≥ 0.5, Silver ≥ 0.75, Gold ≥ 0.95. These are operating defaults, not Databricks-prescribed standards. Even a raw Bronze ingestion can introduce measurable information loss through format conversion, column subsetting, or type coercion — hence the permissive 0.5 floor. A Silver transformation that filters, deduplicates, and standardizes is held to a stricter retention standard because those operations are more refined and intentional, requiring at least 75% of the ingested signal to survive. A Gold aggregation layer, where business-ready datasets are the output, should preserve nearly all of the signal that survived Silver. The thresholds are configurable per data contract, and the right values depend on what each layer is doing to the data.
Entropy and schema validation are complementary, not competitive. Every experiment ran entropy-based controls alongside traditional baselines, not instead of them. Schema validation catches structural defects — missing columns, wrong types, unexpected nulls. Entropy catches distributional defects — collapsed categories, shifted distributions, silent convergence. You need both. The mistake is assuming that passing schema checks means the data is trustworthy.
Evidence discipline changes the conversation. Every run in this research program produced append-only evidence artifacts: JSON bundles with configuration hashes, measured gate values, thresholds, and verdicts. When a downstream consumer asks “how do you know the data is good?”, the answer is not “we ran some checks.” The answer is a specific artifact ID, a specific health score, and a specific gate verdict — queryable, auditable, and immutable.
Applying This in Your Pipeline
Both tools used in this research are open source and available on PyPI. The benchmark results reported in this article were produced on DriftSentinel 0.4.2+ and AetheriaForge 0.1.4+, after the defects described in each product’s customer impact advisory were resolved. If you used DriftSentinel 0.4.1 or earlier, prior bundle-driven control results should be treated as unverified until rerun on a current release.
DriftSentinel uses Shannon entropy as its primary distribution stability signal. Configure monitored columns, set health score thresholds, and let the drift gate block or warn on loads that have lost too much distributional information. Supported drift methods are shannon_entropy and wasserstein, configurable per column based on operator judgment.
pip install etherealogic-driftsentinelAetheriaForge uses Shannon entropy to score information preservation across transformations. Feed it a source DataFrame and a forged DataFrame, and it returns a coherence score between 0.0 and 1.0 — the ratio of information that survived the transformation. Configure layer-aware thresholds so Bronze, Silver, and Gold transformations are held to appropriate standards.
pip install etherealogic-aetheriaforgeBoth deploy as Databricks Apps with four-tab operator dashboards, Asset Bundle definitions for governed deployment, and notebook-based onboarding workflows. Both publish customer impact advisories when defects are found that could affect operator decisions.
The experiment charters, gate contracts, and governing specifications are maintained in a structured research repository with full provenance. The benchmark run bundles, manifests, and reproducibility records that the promotion decisions were based on are available for inspection upon request.
What Comes Next
The validated experimental surface covers Bronze-layer quality validation and drift detection. The next research priorities are:
Operational readiness validation — showing that entropy-based controls can run unattended with service-principal authentication, not just interactive OAuth. This is the narrowest remaining gap between experimental evidence and repeatable, operator-independent execution.
Expanded natural-fault coverage — broadening the curated incident corpus beyond six cases, with independent model evaluation against unlabeled incidents, multi-reviewer adjudication labels, and wider domain coverage.
Silver and Gold layer escalation — extending the validated evidence surface beyond Bronze ingestion into the transformation and aggregation layers where information loss compounds.
Each of these will follow the same discipline: preregistered charters, independent datasets, reproducible evidence, and no claims beyond what the gate verdicts support.
Shannon entropy is not a silver bullet. It does not replace schema validation, freshness monitoring, or volume checks. But it measures something those tools structurally cannot — whether the data still carries the information it carried yesterday. The experiments demonstrate that this measurement is accurate, fast, and operationally useful at scale.
The tools are open source. The gap between validating structure and validating signal is closable — and now there is evidence to back it up.
Anthony Johnson II is a Databricks Solutions Architect and the creator of the Enterprise Data Trust portfolio. He writes about data quality, distribution drift, and the engineering patterns that make data trustworthy at scale.