Your pipeline passed every check. Schema valid. Row count matched. Null percentage within threshold. Freshness on time. Dashboard green.
But this morning the downstream segmentation model lost a third of its signal. Marketing is asking why the “Premium” and “Enterprise” tiers collapsed into a single bucket. Finance wants to know why revenue forecasting diverged from actuals by 12%. The Customer 360 that was supposed to unify 40,000 accounts is quietly deduplicating to 24,000.
Everything validated. Nothing was correct.
If this sounds familiar, you have a monitoring blind spot — and it is not a tooling gap you can solve with more schema checks.
The Monitoring Blind Spot
Most data quality tools validate shape: Is the schema right? Are the types correct? Are nulls within threshold? Did the expected number of rows arrive on time?
These are necessary checks. They are not sufficient.
Here is what none of them measure: information content. A column can go from 12 distinct categories to 8 and every traditional check passes. A distribution can shift from uniform to heavily skewed and row counts will not flinch. Two source tables can silently converge to identical values during a merge, destroying the differentiation your downstream model depends on — and your freshness monitor will report on time.
The problem is not that these tools are wrong. The problem is that they are answering the wrong question. They tell you whether data arrived in the expected shape. They do not tell you whether it still carries the information it carried yesterday.
This is the difference between validating structure and validating signal.
You still need schema validation. Entropy does a different job: it measures whether the distribution still carries the signal your downstream logic depends on.
What Is Shannon Entropy and Why Does It Matter for Data?
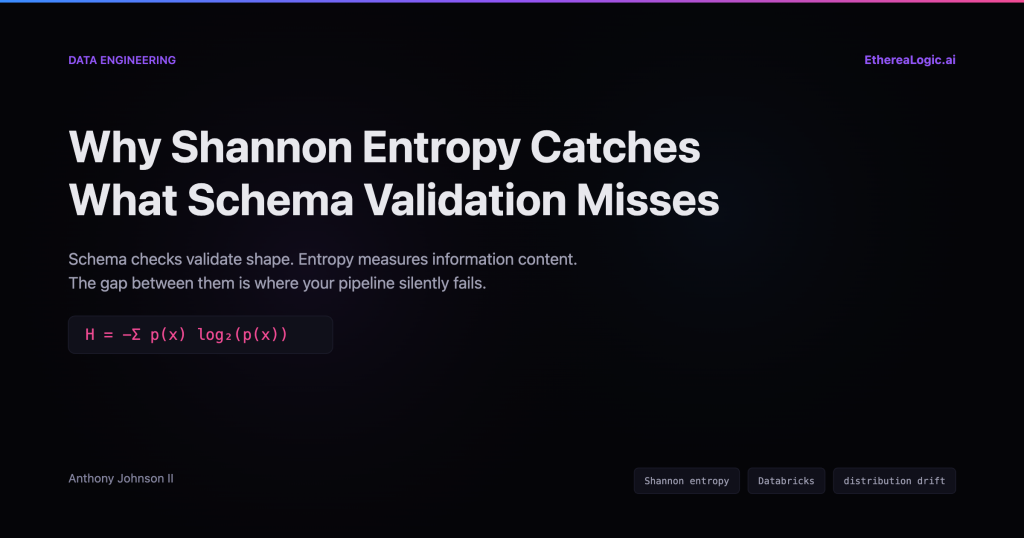
Shannon entropy, introduced by Claude Shannon in 1948, is a measure of information content — specifically, the average amount of uncertainty (or surprise) in a distribution. The formula is straightforward:
H = -Σ p(x) log2(p(x))
Where p(x) is the probability of each distinct value in the distribution.
The intuition: a column where every row is "Active" carries zero information — entropy is 0.0. A column evenly split across 8 categories carries maximum information for that cardinality — entropy is 3.0 bits (log2(8)). The more uniform the distribution, the higher the entropy. The more collapsed or skewed, the lower.
A concrete example
Consider a customer_tier column with 10,000 rows across four values:
Baseline (Monday):
| Value | Count | Probability | -p log2(p) |
|---|---|---|---|
| Free | 2,500 | 0.25 | 0.500 |
| Basic | 2,500 | 0.25 | 0.500 |
| Premium | 2,500 | 0.25 | 0.500 |
| Enterprise | 2,500 | 0.25 | 0.500 |
H = 2.000 bits. Maximum entropy for 4 values. Stability score: 1.0.
Wednesday’s load:
| Value | Count | Probability | -p log2(p) |
|---|---|---|---|
| Free | 4,000 | 0.40 | 0.529 |
| Basic | 3,500 | 0.35 | 0.530 |
| Premium | 2,000 | 0.20 | 0.464 |
| Enterprise | 500 | 0.05 | 0.216 |
H = 1.739 bits. Stability score: 0.870. The column still has four values. Schema passes. Row count matches. But 13% of the distributional information is gone.
Friday’s load:
| Value | Count | Probability | -p log2(p) |
|---|---|---|---|
| Free | 7,000 | 0.70 | 0.361 |
| Basic | 2,800 | 0.28 | 0.514 |
| Premium | 200 | 0.02 | 0.113 |
| Enterprise | 0 | 0.00 | 0.000 |
H = 0.988 bits. Stability score: 0.494. A category has disappeared entirely. The remaining ones have collapsed toward a single dominant value. Your schema check? Still green. Your row count? 10,000 as expected.
But any model trained on the baseline distribution — where all four tiers carried equal weight — is now operating on fundamentally different data. Segmentation, pricing, churn prediction: all degraded.
That is what entropy catches: not whether data arrived, but whether the information content of that data is still intact.
Four Failure Modes Entropy Catches
1. Distribution Collapse
What it looks like: A categorical column gradually loses diversity. A region field that once had 12 values starts arriving with 8. An order_type column concentrates from evenly distributed to 90% dominated by a single value.
Why traditional monitoring misses it: Schema is unchanged. Row count is stable. The remaining values are all valid enum members. Null percentage is fine.
How entropy catches it: The stability score drops proportionally to information loss. A column that drops from 12 evenly distributed categories (H = 3.58 bits) to 8 (H = 3.0 bits, assuming uniform) registers a measurable decline. If the remaining 8 are also skewed, the drop is steeper. DriftSentinel classifies this as collapsed when the score drops below the baseline by more than the configured threshold, and it will gate the load before it reaches downstream consumers.
2. Coherence Loss Across Medallion Layers
What it looks like: Your Bronze-to-Silver transformation is supposed to clean, standardize, and enrich. But somewhere in the pipeline, a join condition is too aggressive, a filter is too broad, or a coalesce is silently flattening variation. The Silver table has fewer distinct value combinations than the Bronze source, even though all the columns are present.
Why traditional monitoring misses it: The Silver schema matches the contract. Types are correct. Row count may even be similar (especially if the issue is value-level collapse rather than row-level filtering).
How entropy catches it: By comparing the Shannon entropy of the source distribution against the target distribution column by column, you get an information-preservation ratio. If Bronze has 4.2 bits of entropy across a column and Silver has 3.1 bits, you have lost 26% of the information content in that transformation. AetheriaForge computes this as a coherence score — a ratio of preserved entropy to source entropy — and enforces layer-specific thresholds: Bronze must preserve at least 50% of information (score >= 0.5), Silver at least 75% (>= 0.75), and Gold at least 95% (>= 0.95).
3. Entity Resolution Drift
What it looks like: Your Customer 360 is supposed to resolve records from multiple source systems into unified entities. But matching logic drift — an overly broad fuzzy match, a changed key format from an upstream system, or a slowly degrading reference table — causes over-matching. Records that should be distinct are getting merged. Your “Customer 360” is actually a Customer 240.
Why traditional monitoring misses it: The output schema is correct. The row count dropped, but entity resolution should reduce rows. There is no null spike. From a structural perspective, the output looks exactly like a successful resolution.
How entropy catches it: The joint entropy of the entity key columns in the resolved output should be close to the joint entropy of the source entity keys (minus the legitimate duplicates you intended to merge). If the resolved output has significantly lower entropy than expected, you are over-merging — collapsing distinct entities into fewer buckets than the source data supports. This is a measurable, quantifiable signal that something has changed in your matching logic or your source key distributions.
4. Temporal Conflict and Silent Overwrites
What it looks like: A latest_wins merge strategy is supposed to resolve temporal conflicts by keeping the most recent record per entity. But when timestamps are missing, malformed, or arriving out of order from different source systems, the “winner” is not the most recent record — it is whichever one the system happened to process last.
Why traditional monitoring misses it: The merge completed without errors. Row count is within expected range. Schema matches. The output looks correct.
How entropy catches it: If temporal conflicts are being resolved incorrectly, the entropy of the output will diverge from what you would expect given the entropy of the inputs. Specifically, if a latest_wins strategy is silently falling back to arbitrary ordering, the output distribution will show unexpected patterns — values from one source system will be systematically overrepresented, reducing entropy in source-identifying columns. AetheriaForge’s coherence scoring across the temporal reconciliation step quantifies this: if the reconciled output carries significantly less information than the inputs warranted, the conflict resolution is not working as intended.
From Theory to Practice
Drift Gating with DriftSentinel
DriftSentinel uses Shannon entropy as its primary distribution stability signal. For each monitored column, it computes a normalized stability score between 0.0 and 1.0, where 1.0 means full diversity (entropy at maximum for the observed cardinality) and 0.0 means the column has collapsed to a constant.
The workflow:
- Baseline capture — When you trust a load, DriftSentinel snapshots the per-column entropy scores as your reference point.
- Drift detection — On each subsequent load, it recomputes entropy scores and compares them against the baseline.
- Classification — Each column is classified as
stable,collapsed, orspikedbased on the score delta. - Gate evaluation — An aggregate health score (mean of all column scores) is evaluated against configurable thresholds to produce a
PASS,WARN, orFAILverdict.
The drift policy configuration is declarative:
drift_policy:
  monitored_columns:
    - column_name: customer_tier
      method: shannon_entropy
    - column_name: transaction_amount
      method: shannon_entropy

  gates:
    health_score_threshold: 0.70
    max_columns_failed: 2

  verdict_on_fail: block
When verdict_on_fail is block, a failing drift gate prevents the load from proceeding to downstream consumers. No silent degradation. No discovering the problem three days later in a dashboard that nobody checked.
The entropy computation itself is compact — the core is a normalized Shannon entropy over value counts:
def column_stability_score(series: pd.Series) -> float:
    counts = series.value_counts(dropna=False)
    n_unique = len(counts)
    if n_unique <= 1:
        return 0.0
    probs = (counts / counts.sum()).to_numpy()
    positive = probs[probs > 0]
    h = -float(np.sum(positive * np.log2(positive)))
    h_max = math.log2(n_unique)
    return round(min(h / h_max, 1.0), 4)
The normalization by h_max is important — it makes scores comparable across columns with different cardinalities. A column with 100 distinct values and a column with 4 distinct values both score 1.0 when their distributions are uniform, and both decline proportionally as they collapse.
Coherence Scoring with AetheriaForge
Where DriftSentinel measures drift within a single dataset over time, AetheriaForge measures information preservation across a transformation. Its coherence score answers: how much of the source’s information content survived the transformation into the target?
def shannon_coherence_score(
    source: pd.DataFrame,
    forged: pd.DataFrame,
    *,
    lineage: Mapping[str, Sequence[str]] | None = None,
) -> float:
    source_entropies = _compute_column_entropies(source)
    total_source_entropy = sum(source_entropies.values())

    if total_source_entropy == 0.0:
        return 1.0

    forged_entropies = _compute_column_entropies(forged)

    preserved_entropy = 0.0
    for col in source.columns:
        if col in forged_entropies:
            preserved_entropy += min(
                forged_entropies[col], source_entropies[col]
            )

    return round(
        max(0.0, min(1.0, preserved_entropy / total_source_entropy)), 6
    )
The key design choice: for each column, the preserved entropy is capped at the source entropy. A transformation cannot create information — it can only preserve or destroy it. If a forged column has higher entropy than its source (which can happen through joins or enrichment), it is credited only up to the source level. This prevents a noisy join from masking information loss elsewhere.
When a schema contract declares lineage — mapping target columns to their source columns — AetheriaForge uses joint entropy across the source columns instead of individual column entropy. This correctly handles cases where a single target column is derived from multiple source columns (e.g., a full_address column constructed from street, city, state, zip).
The thresholds are layer-aware, matching the expectations of the Medallion architecture:
coherence:
  engine: shannon
  thresholds:
    bronze_min: 0.5   # Raw ingestion — expect some loss
    silver_min: 0.75  # Cleaned and standardized — preserve most signal
    gold_min: 0.95   # Business-ready — near-perfect preservation
The verdict logic follows the same PASS / WARN / FAIL pattern. A Silver transformation that scores 0.72 gets a WARN (within the 0.05 tolerance). One that scores 0.68 gets a FAIL, and the pipeline halts with a clear explanation of how much information was lost and where.
What This Means for Your Pipeline
If you are running Medallion Architecture on Databricks, here is what you are probably not measuring:
Distribution stability over time. Your region column had 12 values last month. Does it still? Your product_category was evenly distributed across 8 segments. Is it still, or has one segment quietly absorbed 60% of the volume? You are monitoring whether the column exists and whether it is null. You are not monitoring whether it still carries the same information.
Information preservation across transformations. Your Bronze-to-Silver pipeline applies 14 transformations. How much information survives? You know the output schema is correct. You do not know whether a join condition silently dropped 30% of the distributional variation in your key segmentation columns.
Entity resolution accuracy over time. Your Customer 360 resolved 40,000 source records into 32,000 unified entities last quarter. This quarter it resolved the same source count into 24,000. Is that because you have more legitimate duplicates, or because your matching logic drifted? Without entropy-based measurement, you cannot distinguish the two.
The business cost of these blind spots is not theoretical. When a segmentation model operates on a collapsed distribution, it makes systematically worse decisions: sending the wrong offers to the wrong customers, mispricing risk tiers, and misallocating inventory. When an entity-resolution pipeline over-merges, downstream analytics undercount unique customers, understate market reach, and distort lifetime value calculations. These are not edge cases. They are the predictable consequence of monitoring structure without monitoring signal.
Getting Started
Both tools are open-source, available on PyPI, and designed to run on Databricks.
DriftSentinel — Databricks-native data trust platform for intake certification, drift gating, and control benchmarking.
pip install etherealogic-driftsentinelGitHub: github.com/Org-EthereaLogic/DriftSentinel
AetheriaForge — Coherence-scored transformation engine for entity resolution, temporal reconciliation, and schema enforcement.
pip install etherealogic-aetheriaforgeGitHub: github.com/Org-EthereaLogic/AetheriaForge
Both projects publish customer impact advisories when defects are found that could affect operator decisions: DriftSentinel and AetheriaForge. If you are evaluating data quality tooling, look for that signal. The willingness to publicly disclose what went wrong, who was affected, and what to do about it tells you more about engineering culture than any feature list.
Anthony Johnson II is a Databricks Solutions Architect and the creator of the Enterprise Data Trust portfolio. He writes about data quality, distribution drift, and the engineering patterns that make data trustworthy at scale.